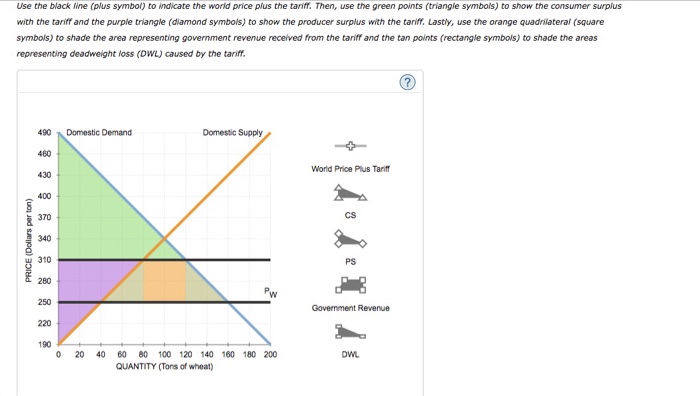
Suppose Kenya is open to free trade in the world market for wheat. Because of Kenya’s small size, the demand for and supply of wheat in Kenya do not affect the world price. The following graph shows the domestic wheat market in Kenya. The world price of wheat is PW = $250 per ton.
On the following graph, use the green triangle (triangle symbols) to shade the area representing consumer surplus (CS) when the economy is at the free-trade equilibrium. Then, use the purple triangle (diamond symbols) to shade the area representing producer surplus (PS).

Ans:

Under free trade:
CS = area of green triangle = (490 - 250) x 160/2
PS = area of purple triangle = (250 - 190) x 40/2
Under a tariff:
CS = area of green triangle = $10800
PS = area of purple triangle =$4800
Government revenue = area of orange square = $2400
Based on your analysis, as a result of the tariff, Kenya's consumer surplus decreases by $8400, producer surplys increases by $3600, and the government collects $2400 in revenue. Therefore, the net welfare effect is a deadweight loss of $2400 (Difference in the two columns calculated above)
You might also like to view...
Moving down along the market demand curve for hot dogs, the
A) maximum price that people are willing to pay for hot dogs increases. B) marginal social benefit of hot dogs decreases. C) marginal social cost of hot dogs increases. D) consumer surplus of the last hot dog consumed increases.
Which of the following is TRUE?
A) A common market is more deeply integrated than a customs union. B) The European Union is a shallower and broader form of integration than NAFTA. C) NAFTA is an example of a customs union. D) Customs unions require the creation of a common currency.

