Exhibit 3-4 Supply curves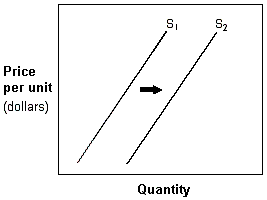
In Exhibit 3-4, a shift in the supply curve from S1 to S2 represents a(n):
A. decrease in supply.
B. decrease in the quantity supplied.
C. increase in supply.
D. increase in the quantity supplied.
Answer: C
Economics
You might also like to view...
The table above gives the CPI for a nation. Based on the table, we can determine that the reference base period is
A) 1994. B) 1996. C) 1998-2000. D) 2002. E) More information about when the Consumer Expenditure Survey was undertaken is needed to answer the question.
Economics
The adverse selection problem is most likely in which of the following occupations?
a. waiter/waitress b. barber c. college professor d. supermarket cashier e. tightrope walker
Economics